A repeatable trade-data workflow records the question, source, product definition, geography, period, transformations, and interpretation in one place. That record turns a one-off search into analysis a colleague can reproduce, update, and challenge before it informs a commercial decision.
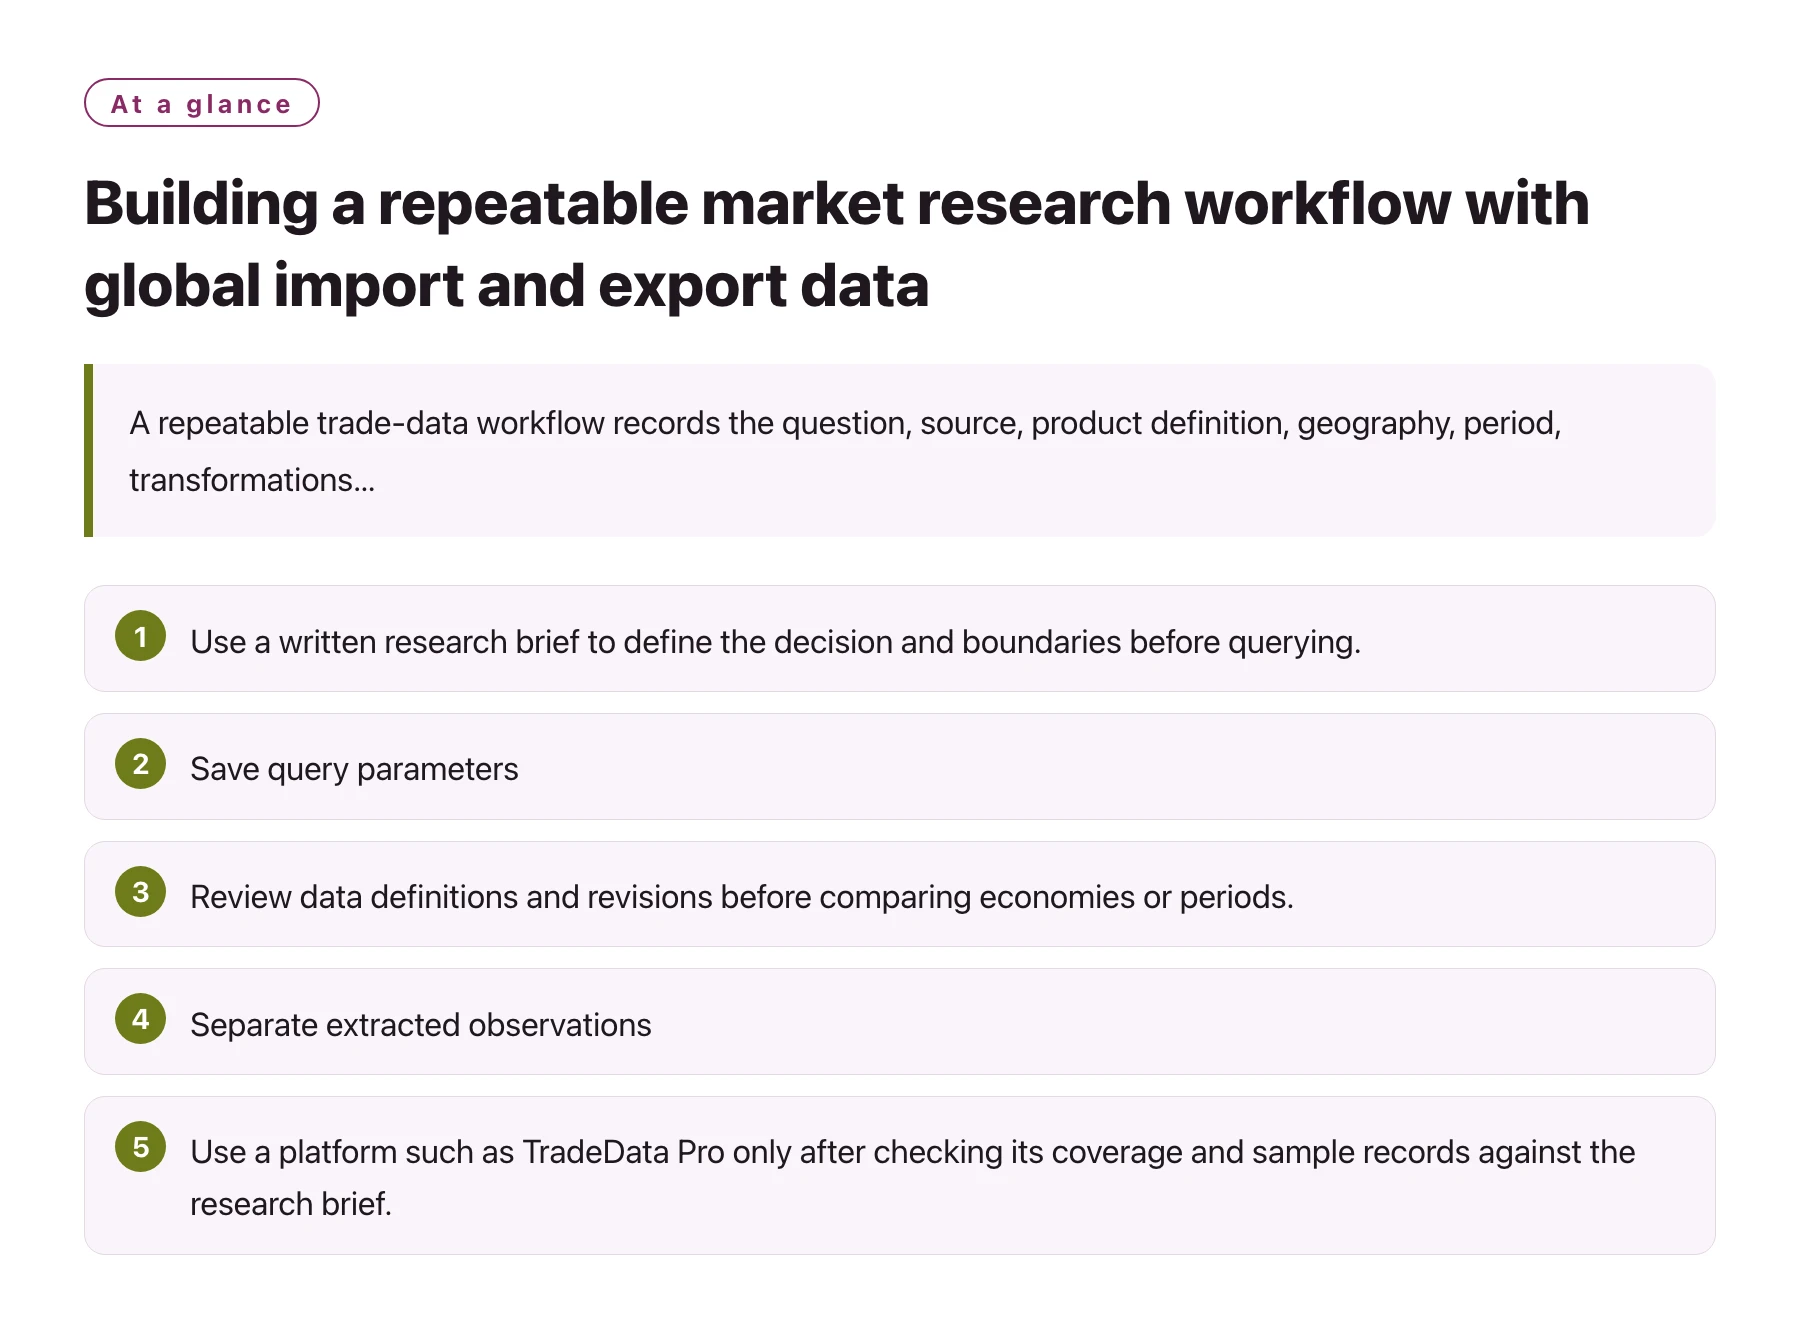
Key takeawaysUse a written research brief to define the decision and boundaries before querying. · Save query parameters, source metadata, classification mappings, and retrieval dates. · Review data definitions and revisions before comparing economies or periods. [1] · Separate extracted observations, analyst interpretation, and recommended actions. · Use a platform such as TradeData Pro only after checking its coverage and sample records against the research brief.
Teams often lose useful research when the analyst who ran the query is the only person who understands its filters. Later, a manager asks why one country was included, a product code changes, or a colleague needs to refresh the work. Without a clear method note, the team may repeat the search incorrectly or use an old result as if it were current.
A repeatable workflow does not require a large governance program. It requires a concise research brief, a consistent data log, and a review step that checks whether the evidence supports the conclusion. The following structure works for market screens and supplier studies, and can be adapted to the analytical tools available.
1. Create a one-page research brief
- DecisionState what choice the research supports and who will make it.
- ScopeDefine product, reporter, partner, flow direction, period, and any exclusions.
- EvidenceList the data fields and sources that would be relevant to the question.
- Decision ruleDescribe what signal would justify further work and what would remain inconclusive.
- LimitsName non-data factors that could change the decision, such as regulation or channel access.
2. Standardize the query record
For each query, save the source name and URL, retrieval date, table or endpoint, selected filters, and any export file. Include the units, currency, aggregation level, classification system, and release vintage where those details are available. If the data came from a platform, note the selected countries, date fields, record filters, and export settings so another user can recreate the result.
The query log should also record changes made after the initial run. An analyst might correct a partner selection, add an alternate product term, or exclude a record class. Keep the reason for the change. This helps distinguish a justified refinement from a search that was repeatedly adjusted until it produced a preferred answer.
For official U.S. trade statistics, the Census Bureau provides several views, including data organized by product classification and geography, historical resources, and an API. The breadth of these resources makes it especially important to note exactly which table or endpoint was used. [2]
3. Maintain a product-code crosswalk
Create a crosswalk between the commercial product vocabulary and the classification terms used in the dataset. It should include the original product name, code, official description, code level, applicable revision, inclusion rationale, and any neighboring codes reviewed but excluded. If a product spans multiple categories, preserve that fact instead of compressing it into a single label.
When the research is repeated for more than one economy, identify which code level is genuinely shared and where national schedules extend the international structure. The same digits can look comparable while representing different detail at a national level. Keep country-specific mappings distinct and aggregate only when the comparison has a defensible common basis.
If the product boundary is uncertain, run a documented sensitivity check. One query can use the narrowest defensible set of codes, and another can use a broader but still relevant set. Report whether the conclusion changes. This provides a practical measure of how much the market screen depends on classification judgment.
4. Add a comparability and revision review
Before calculating trends, check whether the selected observations share a consistent definition. Review coverage, general or special trade treatment, valuation basis, units, reporting periods, and whether the source has revised historical values. The WTO’s statistical notes describe how systems and coverage affect merchandise-trade figures, including treatment of warehouses and re-exports. [1]
For each year or month, distinguish a missing observation from a recorded zero. Flag suppressed values and periods with known breaks. Do not silently fill gaps or use the previous value unless the analytical method explicitly calls for it. If a source revises a period, save the new retrieval date and state whether earlier results were replaced or retained as a historical snapshot.
Where reporter and partner records differ, keep both series with clear labels. Compare definitions and source notes before deciding whether the gap is a problem. A bilateral difference may be important, but it should be explained rather than erased through an undocumented adjustment.
5. Separate the evidence from the interpretation
Use a three-column working note: observation, interpretation, and next check. “Imports reported by economy A for code group B increased across the selected periods” belongs in the observation column. “This suggests an expanding addressable market” belongs in the interpretation column and needs corroboration. “Interview distributors and review product standards” belongs in the next-check column.
This separation helps when a new data point changes the chart. The observation can be updated without rewriting every strategic conclusion. It also gives reviewers a place to challenge an inference without disputing the source extract itself.
For company-oriented research, apply the same discipline to names and records. Save the original name, any normalized form, the matching rule, the record date, and the evidence used to confirm the legal entity. Treat a possible importer or supplier as a lead for validation rather than a verified commercial opportunity.
6. Choose tools by the workflow, not the feature list
A research tool should be judged against the brief. Test a small sample that covers the exact countries, time periods, product terms, and fields needed. Check whether company and shipment results can be traced to the question, whether names are clear enough for follow-up, and whether the output can be saved in a form that supports review.
If the assignment calls for searchable global records and company exploration, TradeData Pro is one platform to evaluate. Compare its coverage, update timing, fields, sample results, and permitted use with the requirements in the brief. The selection should be based on fit for the task rather than on a broad claim that one database contains everything a researcher might need.
Keep official statistics, platform records, and independent company information identified as separate evidence sources. They can complement each other, but differences in scope should remain visible in the final analysis.
7. Preserve the method and set an update trigger
At the end of the project, store a concise readme with the query log, code crosswalk, data files, transformations, chart definitions, and limitations. Identify which files are raw extracts and which are analyst-created outputs. Use stable filenames that include the source and retrieval date, and avoid overwriting the original extract when refreshing the analysis.
Set a reason to rerun the workflow: a new reporting period, a change in product classification, a planned market-entry review, or a material revision by the source. A time-based reminder can also work when the decision is ongoing, but it should not create a false impression that the dataset is updated at a fixed interval unless the source confirms that cadence.
A repeatable process pays off when a new analyst can follow the saved steps, produce a comparable result, and identify what changed since the prior review. That is the standard that makes trade-data market research useful beyond the first presentation.
Sources
Frequently asked questions
What should a trade-data query log contain?
Save the source, retrieval date, table or endpoint, filters, product and geography definitions, units, classification version, and transformations.
Why is a product-code crosswalk useful?
It shows how commercial product terms map to statistical codes, documents inclusion decisions, and makes later updates more consistent.
How often should a market research workflow be rerun?
Set a trigger that fits the decision, such as a new reporting period, a classification change, a source revision, or a planned review. Confirm the source’s actual release cadence.
Can a company record be treated as a verified lead?
Not without further checks. Confirm the legal entity, record date, product relevance, and current business fit independently.